On this Page you will find MAPWORK GRADE 12 NOTES – GEOGRAPHY STUDY GUIDES
5.1 Introduction
Mapwork is a practical section of Geography where you are required to apply all the different skills, techniques and the theory that you have learnt. It consists of the following sections:
- Mapwork calculations
- Reading, interpretation and analysis of theory
- Geographical Information Systems (GIS)
Maps tell you a story about a place. Look at all the information given on the map to interpret it:
- What is the name on the top of the map?
- Look at the latitude and longitude. Get an idea where the map is. For example, 20°S would indicate it is in Limpopo.
- Look at all the information provided (magnetic declination information, scale of the map, contour interval, map projection used) in the ‘margins’ of the map.
- Look at the bottom of the map, for the diagram showing the map sheet reference. It may show additional information such as oceans or borders.
- Notice where roads or railways go off the map. The town they lead to may give you clues.
- Make use of the key/reference list to identify features. Remember, the first word in the reference list refers to the first picture and not both pictures.
Look for the following aspects on the map:
- Is this a high or low rainfall area? Is the rainfall seasonal?
- What kinds of rivers are visible and how many are there?
- Identify the urban and rural areas.
- Identify the different land uses in the mapped area, for example, agricultural/industrial/built-up areas.
- What factors may have affected the location of various land uses?
For example, industry alongside a perennial river. - Identify the type of farming – is it commercial or subsistence?
- Look at the relief – is it flat or hilly, are the slopes steep or gentle?
- Look at the contour lines to determine this.
Look at the information given in the orthophoto:
- Is the orthophoto labelled? If not, check the numbers or letters in the question, for example: ‘Identify land use labelled G on orthophoto’ – G will only be on one of the photos.
- Is a rectangle drawn around the area covered by the orthophoto? If not, orientate the photo to the map.
- Read the instructions carefully as you may need to use both the map and the photograph to answer a question.
- Make use of all the information on the orthophoto, for example, road names, heights, etc.
Remember your calculator, protractor, 30 cm ruler and a pencil.
A topographic map is a way to show mountains, valleys and aspects of a landscape by means of contour lines and intervals.
An orthophoto map is a corrected aerial photograph. Human-made and other features that are not clear are labelled on the orthophoto.
5.2 Some basic mapwork concepts
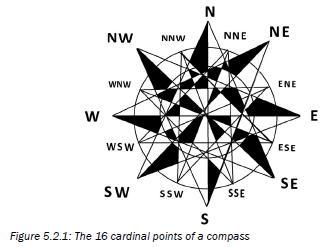
- Direction is expressed using the points on a compass – North, South, East and West, and the points between them. These are known as the 16 cardinal points.
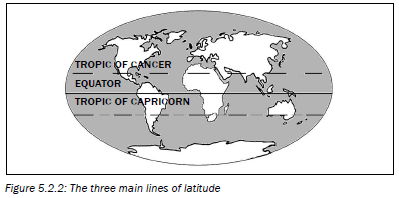
- The three main lines of latitude that run across the surface of the Earth are the equator, the Tropic of Cancer and the Tropic of Capricorn. The equator is the longest line of latitude (where the Earth is widest in an East–West direction). It is located at 0 degrees latitude. The equator divides the planet into the northern and southern hemispheres. The Tropic of Cancer is located at 231/3° north of the equator. The Tropic of Capricorn lies at 231/3° south of the equator. The Tropic of Capricorn runs through northern South Africa.
- Reading a map is as easy as reading a book but, instead of using the alphabet, you have to know the conventional signs used in maps. These help you to see the landscape (relief, drainage, vegetation and huhuman-made features). Conventional signs are used to show particular features. They may be letters of the alphabet or symbols. Many symbols look like the features they represent.
Use the following mnemonic to remember the order of the compass points:
N – Never North
E – Eat East
S – Silk South
W – Worms West
The following table lists some of the symbols you may find on a map:
| Symbol | What it looks like |
| Weir | Represented as a black line across a river, like a dam wall. It is a barrier or mini dam wall which slows down the flow of water. |
| Furrow and canal | Represented as a solid blue line and labelled as furrow or canal. It is used to transport water from source (dam/river) to where it is needed. |
| Aerodrome | A small airport |
| Slimes dam | Represented as a solid black line forming a geometric shape, often rectangular. It stores liquid waste from the mining process. |
| Mine dump | Represented as solid lines radiating out from a central point. It is a small mountain-like feature, often yellowish in colour. It consists of solid waste from the mining process. |
| Rifle range/ shooting range | These are enclosed by a solid black line. This is a place where people practise shooting. |
Table 5.1: Symbols found on maps
Colours are often used to make symbols clearer. There are six colour groups:
| Colour | What it is used for |
| Brown | Land or earth features: Contours, eroded areas, prominent rocky outcrops, sandy areas and dunes, secondary roads |
| Blue | Water features: Aqueducts, canals, furrows, coastlines, dams, lakes, marshes, swamps and vleis, pans, rivers, water-towers. National freeways are also shown in dark blue |
| Green | Vegetation features: Cultivated fields, golf courses, nature and game reserve boundaries, state forest boundaries, orchards and vineyards, recreation grounds, woodland/plantations |
| Black | Construction features: Roads, tracks, railways, buildings, bridges, cemeteries, communication towers, dam walls, excavations and mine dumps, telephone lines, power lines, wind pumps, wrecks, ruins, trigonometrical station, boundaries |
| Grey | Construction features: Built-up areas |
| Red | Construction features: National, arterial and main roads, lighthouses and marine lights. Pink also shows international boundaries |
Table 5.2: Colours used on maps
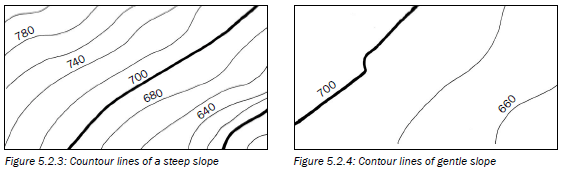
4. Contour lines on a map show the area’s relief (the difference in elevation) or altitude (height in metres of the land above sea level).
The closer together the contour lines are, the steeper the slope is.
The lines are labelled so that you read up the slope.
5.3 Mapwork calculations
5.3.1 Introduction to mapwork calculations
In this section you will learn how to do various mapwork calculations on a topographic map and an orthophoto. These calculations will be explained by means of examples.
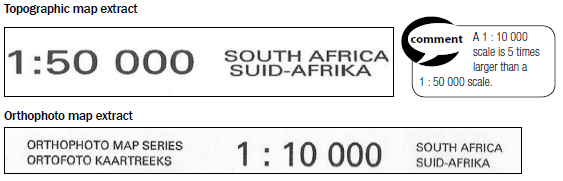
When doing calculations, you will be required to give an answer in kilometres or metres. Always take note of whether the calculation is to be done from a topographic map or an orthophoto, as this will change your scale. The orthophoto scale is larger and provides more detail. Use the conversion table below (Table 5.3).
TOPOGRAPHIC MAP
1 cm : 50 000 cm
1 cm = 500 m
1 cm = 0,5 km |
ORTHOPHOTO MAP
1 cm: 10 000 cm
1 cm: 100 m
1 cm: 0,1 km |
| Scale | If the answer must be in kilometres (km) | If the answer must be in metres (m) |
Topographic map
1:50 000 → | Multiply by 0,5 on a topographic map | Multiply by 500 on a topographic map |
Orthophoto map
1:10 000 → | Multiply by 0,1 on an orthophoto | Multiply by 100 on an orthophoto |
Table 5.3: Converting a given scale to kilometres or metres
 Calculations in mapwork need a good understanding of difference in height and straight line distance to calculate distance, gradient and area.
Look at the example and revise these calculations.
Learn the conversions given in Table 5.3 below.
Example
On a 1:50 000 map
Difference in height (vertical)
Simply subtract the smaller height from the greater height.
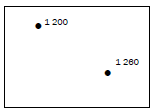
For example, to calculate the difference in height between spot height
1 260 and spot height 1 200:
1 260 − 1 200 = 60 m
Straight line distance (horizontal)
Measure the distance on the map in centimetres and multiply by the scale.
For example, to calculate the distance between spot height 1 200 and spot height 1 260 in kilometres:
Map distance = 2,4 cm
Scale: 1 cm represents 0,5 km
2,4 × 0,5 = 1,2 km
5.3.2 Mapwork calculations: distance, area and gradient
In the exam you may be asked to do distance, area and gradient calculations on a topographic map or an orthophoto. The following are examples of these calculations for both topographic maps and orthophotos. The method and formulae are the same for both kinds of maps, but remember to use the correct conversion calculation on page 103.
Distance
This is the straight line distance from one point to another or the actual distance, e.g distance along a road, railway, hiking trail, etc.
We calculate distance to find out how far one place is from another.
Formula
Actual distance = map distance × scale
AD = MD × S |
Method for calculating distance
Follow these steps:
Step 1: Measure the map distance in centimetres.
Step 2: To convert to kilometres, multiply the map distance by 0,5 if on a topographic map, or by 0,1 if on an orthophoto to get km. To convert to metres, multiply the map distance by 500 if on a topographic map or by 100 if on an orthophoto.
Always take note of the unit in which the answer must be given, for example km or m.
If the exam question asks for “the distance along a road” then you would measure the line as if you were walking on it.
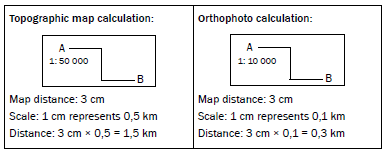
Worked example 1 – straight line distance
Calculate the distance from point A to point B.
Topographic map calculation:
A————————–B
1: 50 000Map distance: 4,6 cm
Scale: 1 cm represents 0,5 km
Distance: 4,6 cm × 0,5 = 2,3 km | Orthophoto calculation:
A—————————-B
1: 10 000Map distance: 4,6 cm
Scale: 1 cm represents 0,1 km
Distance: 4,6 cm × 0,1 = 0,46 km |
Worked example 2 – actual distance
Calculate the distance along the road from point A to point B.
Activity 5.1
Calculate the following distances which are shown on a topographic map.
- Calculate the distance from trig. station 5 to spot height 120 in metres. (3)
- Calculate the distance along the powerline in kilometres. (3)
[6]
Answers to activity 5.1
1. Distance = 4,4 cm3 × 5003 = 2 200 m3 (3)
2. Distance = 6,8 cm 3× 0,53 = 3,4 km3 (3)
[6] |
Activity 5.2
Calculate the following distances which are shown on an orthophoto.
- Calculate the distance from the post office to the dipping tank in metres. (3)
- Calculate the distance along the track in kilometres. (3)
[6]
Answers to activity 5.2- Distance = 6,6 cm3× 1003 = 660 m3 (3)
- Distance = 5,4 cm3 × 0,13 =0,54 km3 (3)
[6]
|
Area
Area is the amount of surface a two-dimensional shape covers. (A twodimensional shape has length and breadth.)
We calculate area to find out how much land is covered (e.g. by a maize field) or how much space we have to build on.
Formula for area
Area = Length × Breadth
A = L × B |
Method for calculating area
Follow these steps:
Step 1: Measure the length in cm and convert to km or m.
Step 2: Measure the breadth in cm and convert to km or m.
Step 3: Apply the formula A = L × B.
Step 4: Write the answer in kilometres squared (km²) or metres squared (m²).
Worked example
| Topographic map calculation: | Orthophoto calculation: |
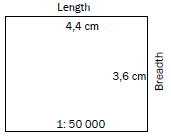
Answer in km²
A = L × B
L: 4,4 cm × 0,5 = 2,2 km
B: 3,6 cm × 0,5 = 1,8 km
A: 2,2 × 1,8 = 3,96 km²Answer in m²
A = L × B
L: 4,4 cm × 500 = 2 200 m
B: 3,6 cm × 500 = 1 800 m
A: 2 200 × 1 800 = 39 600 m² | 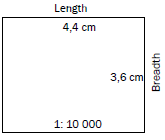
Answer in km2
A = L × B
L: 4,4 cm × 0,1 = 0,44 km
B: 3,6 cm × 0,1 = 0,36 km
A: 0,44 × 0,36 = 0,1584 km²Answer in m2
A = L × B
L: 4,4 cm × 100 = 440 m
B: 3,6 cm × 100 = 360 m
A: 440 × 360 = 158 400 m² |
Activity 5.3
- The block below is shown on a topographic map. Calculate the area of the block in metres squared.
 (5)
(5) - The block below is shown on a topographic map. Calculate the area of the block in kilometres squared.
 (5)
(5)
[10]
Always write the formula A = L × B. It’s an easy mark.
Answers to activity 5.3- A = L × B
L: 3,7 cm × 500 = 1 850 m
B: 1,1 cm × 500 = 550 m
A: 1 850 × 550 = 1 017 500 m² (5) - A = L × B
L: 4,4 cm × 0,5 = 2,2 km
B: 2,3 cm × 0,5 = 1,15 km
A: 2,2 × 1,15 = 2,53 km² (5)
[10]
|
Activity 5.4
- The block below is shown on an orthophoto. Calculate the area of the block in metres squared.
 (5)
(5) - The block below is shown on an orthophoto. Calculate the area of the block in kilometres squared.
 (5)
(5)
[10]
Answers to activity 5.4- A = L × B
L: 4,4 cm × 100 = 440 m
B: 1,1 cm × 100 = 110 m
A: 440 × 110 = 48 400 m² (5) - A = L × B3
L: 1,1 cm × 0,1 = 0,11 km
B: 1,1 cm × 0,1 = 0,11 km
A: 0,11 × 0,11 = 0,0121 km² (5)
[10]
|
Gradient
Gradient is the relationship between height and distance. The gradient tells us how steep a straight line is.
We calculate gradient to find out how steep or gentle a slope is.
Formula for gradient
Gradient = Height (vertical)
Distance (horizontal)
OR
G = H
D |
Method for calculating gradient
Follow these steps:
Step 1: Calculate the difference in height by subtracting the lowest height from the highest height. The answer must be in metres.
Step 2: Measure the distance in cm.
Step 3: Convert to metres by multiplying by 500 (if you are working with a topographic map) or by 100 (if you are working with an orthophoto).
Step 4: Write the two answers as a ratio.
Step 5: Divide both sides of the ratio by the height. This is so we can get a ratio of 1 to a relative number, in other words, distance.
Step 6: Your answer is the gradient written as a ratio.
Worked example
| Topographic map calculation: | Orthophoto calculation: |
Calculate the gradient between 5400 and ·5000
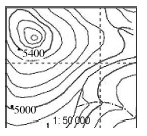
G = H
D
H: 5 400 – 5000 = 400 m
D: 2,2 cm × 500 = 1 100 m
G: 400:1 100
400:400
= 1:2,75 | Calculate the gradient between ·5400 and ·5000
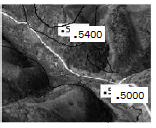
G = H
D
5 400 – 5 000 = 400
11 cm × 100 1 100
400: 1 100
400
= 1:2,75 |
Always write the formula G = H in your answer. This will give you a mark.
D
Activity 5.5
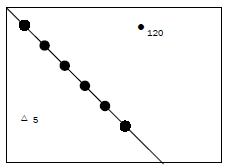
Calculate the gradient from trig. station 8 to spot height 1120, which are shown on a topographic map.
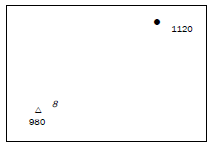
Note that 8 is the number of the trig. station. The height is written below the triangle, i.e. it is 980.
Answer to activity 5.5
G = H
D
H: 1 120 − 980 = 140 m
D: 4,4 cm × 500 = 2 200 m
G: 140 : 2 200
140 140
= 1:15,71
[5] |
Activity 5.6
Calculate the gradient from trig. station 8 to spot height 213, which are shown on an orthophoto. [5]
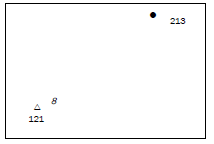
Answer to activity 5.6
G = H
D
H: 213 − 121 = 92 m
D: 4,4 cm × 100 = 440 m
G: 92 : 440
92 92
= 1:4,78
[5] |
5.3.3 Mapwork calculations: True bearing, magnetic declination, magnetic bearing, position, map sheet reference, vertical exaggeration
Note that true bearing, magnetic declination, magnetic bearing and position, and map sheet reference calculations can only be done on a topographic map. Vertical exaggeration calculations can be done on both a topographic map and an orthophoto.
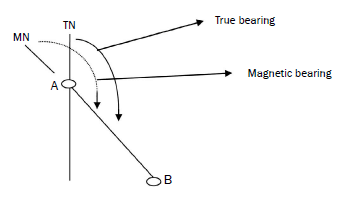
True bearing
True bearing is the angle measured clockwise from true north (0°).
We calculate true bearing, magnetic declination and magnetic bearing to help us determine in which direction we are going or to help us find our way.
Method for measuring the true bearing from A to B
Follow these steps:
Step 1: Draw a straight line joining A and B.
Step 2: Draw a north line through A (the point of measurement).
Step 3: Place the 0 of your protractor at the top of the north line.
Step 4: Moving in a clockwise direction from 0, read off where the line joining A and B touches the protractor. |
The true bearing from A to B is 138°. (In the exam, a degree either way will be accepted, i.e. the answer can be 137° to 139°.)
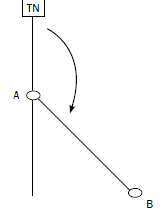
Always remember to move to the right (clockwise).
Activity 5.7
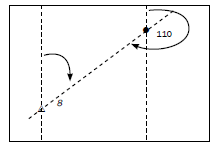
- Calculate the true bearing from trig. station 8 to spot height 110. (2)
- Calculate the true bearing of trig. station 8 from spot height 110. (2)
[4]
Answers to activity 5.7- 58° (57°– 59°) (2)
- 238° (237°– 239°) (2)
[4]
|
Magnetic declination
Magnetic declination is the angle between true north and magnetic north. This angle is calculated when the map is drawn, but the position of magnetic north changes, so the angle between true north and magnetic north (the magnetic declination) will also change. You will need to calculate what the magnetic declination is for the current year.
You will find the magnetic declination for the year the map was drawn on the map. This information appears on a map on the left-hand side or at the bottom of the map. You need this information to do the magnetic declination calculation. Look at the following example:
Example
Mean magnetic declination (MD) 20º 10’ west of true north (1990.01)
Mean annual change (AC) 2’ westwards (1985–1995)
Note the following:
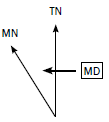
TN is true north. This is found at the North Pole.
- MN is magnetic north. This is the direction in which a compass would point.
- MD is the magnetic declination. It is the angle you are calculating.
- 1990.01 refers to the year and the month that the declination was recorded.
- 1985–1995 refers to the years the mapmaker used to get the mean (average) magnetic declination. You will not need these years.
- Mean annual change refers to how much the magnetic declination changes by each year. The change is in minutes (this is shown by the symbol ‘).
- The declination can change in a westerly (angle increases) or easterly (angle decreases) direction.
Method for calculating magnetic declination
Follow these steps:
Step 1: Work out the difference in years between the current year and year given on the map. Your answer must be in years. (Use the year that is printed straight after the words ‘true north’. You can ignore the month that is shown.)
Step 2: Multiply the number of years with the mean annual change (this is given on the map) to get the change since the declination was recorded.
Step 3: If the mean annual change is eastwards, then you have to subtract the change from the magnetic declination given. If the mean annual change is westwards, then you must add it to the given magnetic declination.
Step 4: Your answer is the magnetic declination for the current year. Magnetic declination is always west of true north. |
Worked example 1: If the annual change is westwards
Mean magnetic declination (MD) 20º 10’ west of true north (1990.01)
Mean annual change (AC) 2’ westwards (1985–1995)
Calculating magnetic declination for 2012
MD = 20° 10’ W of TN
AC = 2’ W
2012 – 1990 = 22 years
22 × 2’ W = 44’ W
MD = 20° 10’ W + 44’ W = 20° 54’ W of TN
Worked example 1: If the annual change is eastwards
Mean magnetic declination (MD) 18º 50’ west of true north (1985.01)
Mean annual change (AC) 1’ eastwards (1980–1990)
Calculating magnetic declination for 2012
MD = 18° 50’ W of TN
AC = 1’ E
2012 − 1985 = 27 years
27 × 1’ E = 27’ E
MD = 18° 50’ W – 27’ E = 18° 23’ W of TN
Worked example 3: If the magnetic declination is given with a decimal place instead of minutes
If the MD given on the map is recorded as a decimal, for example 23°,5 W, you must multiply the number after the comma by 6 to convert it to minutes. For example:
5 × 6 = 30’. So, the MD is now 23°30’ W. The decimal comma has been removed and you have a MD in degrees and minutes.
Now look at the following worked example:
Mean magnetic declination (MD) 18º,3 west of true north (1985.01)
Mean annual change (AC) 1’ westwards (1980–1990)
Calculating magnetic declination for 2012
MD = 18°,3 W of TN = 18° 18’ W of TN
AC = 1’ W
2012 – 1985 = 27 years
27 × 1’ W = 27’ W
Worked example 4: If the magnetic declination answer has the minutes greater than 59’
Once you have done your calculation, if the magnetic declination for the current year has minutes greater than 59’ you need to convert the minutes to degrees.
For example: MD = 23° 76’
76’ – 60’ leaves 16’. The 60 minutes you subtracted equal 1 degree, which you add to the 23° to get 24° 16’.
Now look at the following worked example:
Mean magnetic declination (MD) 31º 33’ west of true north (1990.08)
Mean annual change (AC) 2’ westwards (1987–1993)
Calculating magnetic declination for the current year
MD = 31° 33’ W of TN
AC = 2’ W
2012 – 1990 = 22 years
22 × 2’ W = 44’ W
MD = 31° 33’ W + 44’ W
= 31° 77’ W of TN
= 32° 17’ W of TN
Worked example 5: When the change is eastwards and the change is greater than the minutes in the MD
If the mean annual change has minutes greater than the minutes in the magnetic declination, you need to borrow a degree in the magnetic declination and convert it into minutes. Look at the following example:
MD = 20° 10’ W – 44’ E
Before you can subtract the mean annual change of 44’ E from the given magnetic declination, you need to borrow 1° from 20° and convert it to minutes. This leaves you with 19°. Now take the 1° and convert it to 60’ (remember that 1° = 60’). Now add the 60’ to the 10’. This gives you 70’. Now you can continue with the calculation:
19° 70’ – 44’ E = 19° 26’ W
Now look at the following worked example:
Mean magnetic declination (MD) 25º 32’ west of true north (1986.04)
Mean annual change (AC) 2’ eastwards (1983–1992)
Calculating magnetic declination for 2012
MD = 25° 32’ W of TN
AC = 2’ E
2012 – 1986 = 26 years
26 × 2’ E = 52’ E
MD = 25° 32’ W – 52’ E
= 24° 92’ – 52’
= 24° 40’ W of TN
Remember that 1° = 60’ (1 degree = 60 minutes)
- Always add degrees to degrees and minutes to minutes. Never add degrees to minutes.
- Always subtract degrees from degrees and minutes from minutes. Never subtract minutes from degrees!
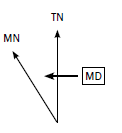
Magnetic bearing
Magnetic bearing is the angle measured clockwise from magnetic north.
Here the magnetic north line is taken as 0º whereas in true bearing, true north is taken as 0°.
Formula for magnetic bearing
Magnetic bearing = true bearing + magnetic declination
MB = TB + MD |
Method for calculating magnetic bearing
To get the true bearing and the magnetic declination we use the same methods applied in 5.3.3A (on page 111) and 5.3.3B (on page 112).
These methods are provided again below. Follow these steps:
Step 1: Measure the true bearing from A to B (as described in 5.1.3A)
Step 1a: Draw a straight line joining A and B.
Step 1b: Draw a north line through A (the point of measurement).
Step 1c: Place the 0 of your protractor at the top of the north line.
Step 1d: Moving in a clockwise direction from 0, read off where the line joining A and B touches the protractor.
Step 2: Calculate the magnetic declination (as described in 5.1.3B)
Step 2a: Work out the difference in years between the current year and year given on the map. Your answer must be in years. (Use the year that is printed straight after the words ‘true north’. You can ignore the month that is shown.)
Step 2b: Multiply the number of years with the mean annual change (this is given on the map) to get the change since the declination was recorded.
Step 2c: If the mean annual change is eastwards, then you have to subtract the change from the magnetic declination given. If the mean annual change is westwards, then you must add it to the given magnetic declination.
Step 2d: Your answer is the magnetic declination for the current year.
Magnetic declination is always west of true north.
Step 3: Now add the true bearing to the magnetic declination. Your answer must not have a direction (north, south, east or west) because it is an angle measured only in degrees and minutes.
Example
MD = 18°,8 W = 17° 48’ W
Change in years = 2012 – 1988 = 24 years
Change since 1989 = 24 × 4’ = 96’ W = 1° 36’ W
MD = 17° 48’ + 1° 36’
= 18° 84’ W = 19° 24’ W
TB = between 299° and 303°
MB = TB + MD
= 301° + 19° 24’
MB = 320° 24’
Always write the formula MB = TB + MD in your calculations as this will earn you a mark.
Worked example 1
Mean magnetic declination (MD) 20º, 2’ west of true north (2001.09)
Mean annual change (AC) 1’ westwards (1998–2004)
Calculate the magnetic bearing of the post office from the dipping tank for 2012.
MB = TB + MD
TB = 272° (271°– 273°)
MD = 20°, 2 W of TN = 20°12’ W of TN
AC = 1’ W
2012 – 2001 = 11 years
11 × 1’ W = 11’ W
MD = 20° 12’ W + 11’ W = 20° 23’ W of TN
MB = 20° 23’ + 272°
= 291° 23’– 293° 23’
Worked example 2
Mean magnetic declination (MD) 20º 31’ west of true north (1998.10)
Mean annual change (AC) 4’ westwards (1995–2001)
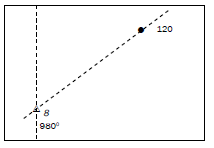
Calculate the magnetic bearing from trig. beacon 8 to spot height 120 for 2012.
MB = TB + MD
TB = 57° (56°– 58°)
MD = 20°31’ W of TN
AC = 4’ W
2012 – 1998 = 14 years
14 × 4’ W = 56’ W
MD = 20° 31’ W + 56’ W
= 20° 87’ W of TN
= 21° 27’ W of TN
MB = 21° 27’ + 57°
= 77° 27’ – 79° 27’
Position/co-ordinates
Co-ordinates are a set of two numbers that indicate the exact position of any point on Earth. Latitude is the co-ordinate that specifies the north– south position of a point on the Earth’s surface. Longitude is the coordinate that specifies the east–west position of a point on the Earth’s surface.
Co-ordinates are useful as they tell us exactly where a place or landform is.
Example of position/co-ordinates
If you wanted to locate a house and only had the co-ordinates 35°S 29°E, you would have to search an area of 6 084 km2. You would need to be more specific when giving the location of a place.
Note the following about position/co-ordinates:
- On a 1:50 000 map the numbers in the top left corner indicate latitude and longitude. Latitude and longitude are measured in degrees and minutes.
- Each line drawn on a map is 1’ of latitude or longitude (‘ is the sign for a minute).
- Each fifth minute on a map is labelled. This helps you to count accurately.
- Latitude minutes increase as you move south (down the map). Longitude minutes increase as you move east (to your right along
- the map).
- The correct format for writing position is as follows:
_____° ____,___’ S
_____° ____,___’ E
Think of latitude and longitude in the following way:
L A T I T U D E
O
N
G
I
T
U
D
E |
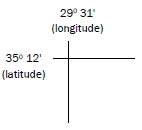
Method for finding the position of an object
You can calculate the position of spot height 501 using the diagram in Figure 5.3.1.
Learn the format for writing position. Note that you always write latitude N or S first.
Use the following steps
Step 1: Write the format for position like this (leaving the blanks for you to fill your answer in later).
_____° ____,___’ S
_____° ____,___’ E
Step 2: Work out the degrees for latitude and longitude for the map.
They are written in the top left-hand corner of the map. Write the degrees down on your format.
24° ____,___’ S
31° ____,___’ E
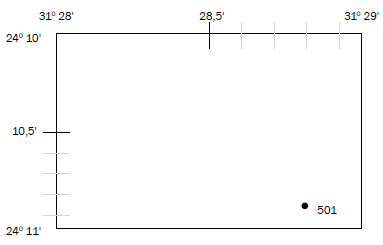
Step 3: Work out the minutes for latitude and longitude. The spot height is in the 10′ block for latitude (not the 11′ block for latitude) and the 28′ block for longitude (not the 29′ block for longitude). Write the minutes down in the blank spaces of your position format.
24° 10′,___’ S
31° 28′,___’ E
Step 4: Measure the distance between 10′ and 11′ and divide it by 2. Then make a mark on the line between 10′ and 11′ where 3 cm is.
Step 5: Measure the distance between 28′ and 29′ and divide it by 2.
Make a mark on the line between 28′ and 29′ where 4,7 cm is. Step 6: The space between 10′ and 11′ is divided into 10 decimal places, in other words, 10,1′; 10,2′; 10,3′; 10,4′; 10,5′; 10,6′; 10,7′; 10,8′ and 10,9′.
As the spot height is in the bottom half of the block, we are only concerned with the 10,5’ to 10,9’ part of the block.
Once you have divided the block in half, divide the half you are interested in equally with 4 lines. This can be done freehand (without a ruler), but judge carefully so that the spaces are equal.
Step 7: The space between 28′ and 29′ is divided into 10 decimal places, in other words, 28,1′; 28,2′; 28,3′; 28,4′; 28,5′; 28,6′; 28,7′; 28,8′ and 28,9′.
As the spot height is in the right-hand half of the block, we are only concerned with the 28,5′ to 28,9′ part of the block.
Once you have divided the block in half, divide the half you are interested in equally with 4 lines. This can be done freehand (without a ruler), but judge carefully so that the spaces are equal.
Steps 6 and 7 are shown below:
Step 8: Line up your ruler with the spot height and the line for latitude (on the left of the map). Make a mark. Read off the decimal place for latitude and write it down on your position format. 24° 10,8′ S or 24° 10,9′ S (both answers are acceptable)
Step 9: Line up your ruler with the spot height and the line for longitude (at the top of the map). Make a mark. Read off the decimal place for longitude and write it down on your format.
Your answer is now complete:
24° 10,8′ S or 24° 10,9′ S (both answers would be accepted)
31° 28,8′ E
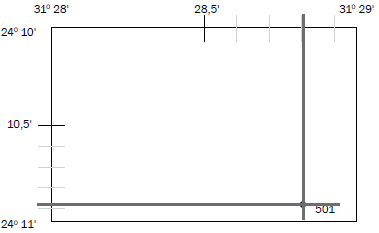
-After 10,9’ it becomes 11’, so you can never have 10,10’.
After 28,9’ it becomes 29’, so you can never have 28,10’
-Make sure your ruler is straight by lining up the markings on the ruler with any of the lines on the map.
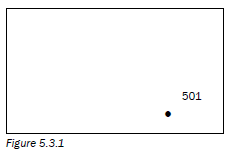
Example
The position of spot height
501 in Figure 5.1 is…
A. 31° 28,8’ S; 24°10,8’ E
B. 31° 28,8’ E; 24° 10,8’ S
C. 24° 10,8’ S; 31° 28,8’ E
D. 24°11,8’ S ; 31° 29,8’ E
(The correct answer is C.)
-In the exam, position is often asked in the multiple-choice section of the paper. Be careful, as an answer may look correct – but longitude is written first! You should know this is wrong because latitude is always written first!
Map sheet references/map code
The map sheet reference is the title of the map and refers to the area that the map covers. The sheet reference links one South African map to all the maps of South Africa.
An example of a map sheet reference is 3318CD. The digits (numbers) and letters have specific meaning:
The numbers in the map sheet reference refer to the intersection of the lines of latitude and longitude (3318CD). The first two numbers refer to latitude (33) and the last two numbers refer to longitude (18). The letters CD refer to the blocks.
The area within these lines of latitude and longitude is divided into four squares, labelled A, B, C and D (big blocks).
Each of the big blocks is then subdivided into four smaller squares, also labelled A, B, C and D (small blocks).
Remember, latitude (N or S) is always written first.
In the exam, you may be asked two types of questions based on the map sheet reference:
- Typical question 1: What is the map sheet reference of the map? (You will find the answer at the top of the map in front of the name of the place shown on the map.)
- Typical question 2: Name the map sheet reference in any direction from the given map sheet reference. (This is explained in Examples 1 and 2 below.)
Example 1
For the map title 3318CD Cape Town:
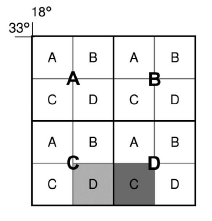
Give the map sheet reference to the east of 3318CD.
- The block to the east of 3318CD (light shading) is block C (darker shading).
- This block is still within the 33° latitude and 18° longitude area, so the numbers (3318) stay the same.
- But it is now in big block D, so the letters change to DC.
- The map sheet to the east of 3318CD is 3318DC.
Practise this type of question by trying the following:- Give the map sheet reference for the map to the north of 3318CD.
- Give the map sheet reference for the map to the north-east of 3318CD.
- Give the map sheet reference for the map to the north-west of 3318CD.
Answers: - 3318CB
- 3318DA
- 3318CA
|
Example 2
For the map title 3318CD Cape Town.
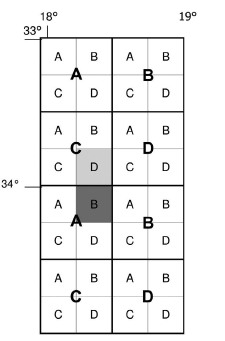
Give the map sheet reference to the south of 3318CD.
- The block to the south of 3318CD (light shading) is the block B (darker shading).
- This block is out of the 33° latitude area and in the 34° latitude area. However, the block is still within the 18° longitude area. The latitude changes but the longitude stays the same (3418).
- It is now in big block A, so the letters change to AB.
- The map sheet to the south of 3318CD is 3418AB.
Always look for a grid showing the map sheet reference at the bottom of a map sheet. It may also provide you with information to help you answer other questions.
Practise this type of question by trying the following:- Give the map sheet reference for the map to the south-east of 3318CD.
- Give the map sheet reference for the map to the south-west of 3318CD.
Answers: - 3418BA
- 3418AA
|
When answering this type of question, take note of the following:
- If you are asked for the grid reference north and you go north (up) out of the big block, the latitude must decrease by 1°.
- If you are asked for the grid reference south and you go south (down) out of the big block, the latitude must increase by 1°.
- If you are asked for the grid reference east and you go east (right) out of the big block, the longitude must increase by 1°.
- If you are asked for the grid reference west and you go west (left) out of the big block, the longitude must decrease by 1°.
Vertical exaggeration
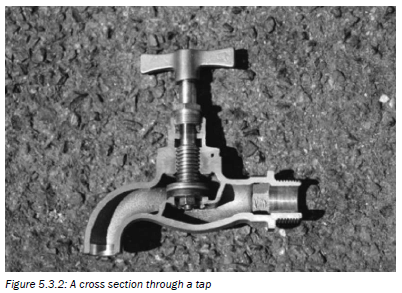
In mapwork, we draw a cross section (view from the side) of an area or landform to better understand what the area or landform looks like.
A cross section is when we ‘cut’ through a landform, to see what it looks like from the side. Figure 5.3.2 below shows a cross section through a tap.
To draw a cross section of a landform, we need to look at the contour lines.
These are the brown lines we see all over a topographic map. Contour lines show the height of the area. Along one contour line, the height is the same.
Study Figure 5.3.2 to understand what is meant by the term cross section.
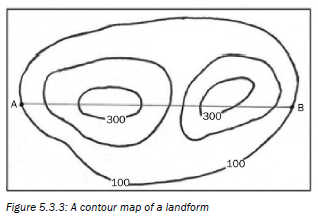
Figure 5.3.3 below is a contour map of a landform. If we had to draw a cross section from A to B on Figure 5.3.3 we would first imagine we were walking from A to B:
- Looking at the heights on the contours we see we are walking uphill;
- Then we go downhill a little bit;
- Then uphill again; and
- Then downhill to B.
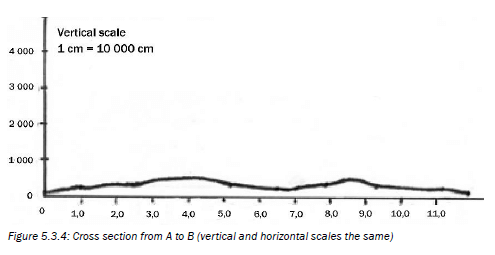
A cross section is drawn on a graph. We use the vertical axis to show the height and horizontal axis to show the distance.
If the vertical and horizontal scales are the same, it is not easy to see the differences in slope.
Figure 5.3.4 below shows the cross section from A to B (in Figure 5.3.3).
Because the vertical and horizontal scales are the same (1:10 000), we do not really get a good idea of the differences in slope.
To overcome this problem, we exaggerate (make it more obvious or clear) the profile vertically by using a different vertical scale from the horizontal scale. This is shown in Figure 5.3.5.
Figure 5.3.5 uses a vertical scale where 1 cm represents 20 m for the same map. It is much easier to see the changes in slope along the profile.
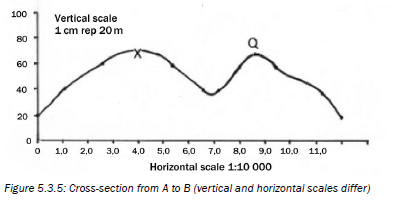
We therefore say the cross-section has been exaggerated, and we need to calculate how many times it has been made steeper or exaggerated. This is called the vertical exaggeration.
Formula to calculate vertical exaggeration
Vertical exaggeration = Vertical scale divided by Horizontal scale
VE = VS ÷ HS
or
VE = VS
HS |
Remember the horizontal scale lies the same way as the horizon.
Method for calculating vertical exaggeration
Follow these steps:
Step 1: Change the vertical scale from a word scale to a number scale. The vertical scale will be given to you in the question, e.g. 1 cm = 40 m.
You must have the same units on both sides of the vertical scale in order to write it as a number scale. We need to convert 40 m into cm. To do this you multiply the 40 m by 100 (1 m = 100 cm).
Our scale becomes 1 cm = 4 000 cm or 1
4 000
Step 2: The horizontal scale is already written as a number scale. On a topographic map the scale is 1:50 000 and on an orthophoto the scale is 1:10 000.
Step 3: Write both scales as fractions and divide the vertical scale by the horizontal scale:
VE = 1 ÷ 1
4000 50 000
Step 4: Now ‘tip and times’ the two fractions. You do this by swopping the top and bottom numbers of the horizontal scale fraction and then multiplying the top of each fraction together and the bottom of each fraction together.
VE = 1 × 50 000
4000 1
Step 5: You are now left with one fraction. Divide the top by the bottom.
(Use your calculator to divide 50 000 by 4 000.)
VE = 50 000
4 000
An easy way to remember that the horizontal scale goes on top is that ‘H’ comes before ‘V’ in the alphabet.
Step 6: Write the answer as follows: VE = 12,5 times
This means the cross section has been exaggerated 12,5 times in order to see the changes in the landscape more easily.
Example of a topographic map calculation:
Calculate the vertical exaggeration for a cross section drawn on a topographical map with a vertical scale of 1 cm = 20 m.
VE = VS ÷ HS
Step 1:
VS: 1 cm = 20 m
1 cm = 20 × 100 cm = 2000 cm
VS 1:2000
VS 1
2 000
Step 2:
HS 1:50 000
HS 1
50 000
Step 3:
VE = 1 ÷ 1
2 000 50 000
Step 4:
VE = 1 × 50 000
2 000 1
Step 5:
VE = 50 000
2 000
Step 6:
Answer:
VE = 25 times | Example of an orthophoto calculation:
Calculate the vertical exaggeration for a cross section drawn on an orthophoto with a vertical scale of 1 cm = 20 m.
VE = VS ÷ HS
Step 1 :
VS: 1 cm = 20 m
1 cm = 20 × 100 cm = 2000 cm
VS 1:2000
VS 1
2 000
Step 2:
HS 1:10 000
HS 1
10 000
Step 3:
VE = 1 ÷ 1
2 000 10 000
Step 4:
VE = 1 × 10 000
2 000 1
Step 5:
VE = 10 000
2 000
Step 6:
Answer:
VE = 5 times |
Worked example 1
Calculate the vertical exaggeration for a cross section drawn on a topographical map with a vertical scale of 1 cm = 50 m.
Answer
VE = VS ÷ HS
VS: 1 cm = 50 m
1 cm = 50 × 100 cm = 5000 cm
VS 1:5 000
VS 1
5 000
HS 1:50 000
HS 1
50 000
VE = 1 ÷ 1
5 000 50 000
VE = 1 × 50 000
5 000 1
VE = 50 000
5 000
VE = 10 times
Always write the formula VE = VS ÷ HS as this will earn you a mark.
Worked example 2
Calculate the vertical exaggeration for a cross section drawn on an orthophoto map with a vertical scale of 1 cm = 25 m.
Answer
VE = VS ÷ HS
VS: 1 cm = 25 m
1 cm = 25 × 100 cm = 2 500 cm
VS 1:2 500
VS 1
2 500
HS 1:10 000
HS 1
10 000
VE = 1 ÷ 1
2 500 10 000
VE = 1 × 10 000
2 500 1
VE = 10 000
2 500
VE = 4 times
Intervisibility
Intervisibility is used to determine whether one place is visible from another place, in other words, whether you can see one place from another place.
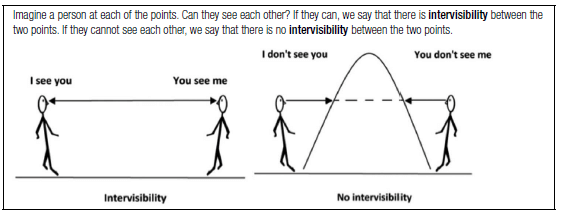 Method to determine intervisibility
To work out whether two places are intervisible, follow these steps:
Step 1: Draw a line joining the points between the two places.
Step 2: Look to see if the line you have drawn cuts through any part of the cross section. If it does cut through, then there is no intervisibility between the two points. If it does not cut through, then there is intervisibility between the two points.
In the exam, you may be given a cross section and asked to determine if two places are intervisible.
Example 1
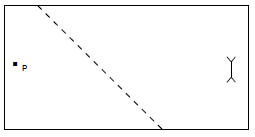
In Figure 5.3.6 below, is point Q intervisible from point P?
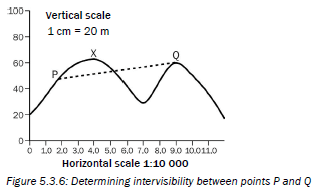
The answer is that there is no intervisibility between P and Q, as the line cuts through the cross-section (goes through the mountain). This means you cannot see point Q from point P, and you cannot see point P from point Q.
Example 2
In Figure 5.3.7 below, is point X intervisible from point Q?
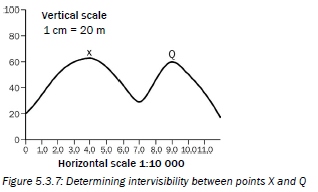
The answer is there is intervisibility between X and Q, as the line does not cut through the cross-section. This means you can see point X from point Q, and you can see point Q from point X.
Activity 5.8
Refer to the topographical map and orthophoto of Nelspruit at the back of this study guide to answer the following questions:
- Calculate the area covered by block B3 on the Nelspruit topographical map in kilometres squared. (5)
- Calculate the magnetic bearing for 2012 from trig. beacon 101 (C3) to spot height 676 (C4) on the topographical map. Show all steps followed (calculations). Marks will be allocated for calculations. (10)
- Calculate the gradient between trig. beacon 101 in block C3 and spot height 676 in block C4. (5)
[20]
Check how well you can do mapwork calculations by completingactivity 5.8.
Answers to activity 5.8
- Area = length × breadth
= (3,7 cm × 0,5) km × (3,3 cm × 0,5) km
= 1,85 km × 1,65 km
= 3,05 km2(5) - Magnetic declination: 15°02′ west of true north
Annual change: 03′ E
Number of years: 2012 – 1986 = 26 years
26 × 3′ = 78′ E = 1° 18′ E
Magnetic declination: =15°02′ W – 1°18′ E
= 14° 62′ W – 1° 18′ E
= 13°44′ W
Magnetic bearing = True bearing + Magnetic declination
= 102° + 13° 44′ W
= 115° 44′ (10) - Gradient = Height = H
Distance D
H = 754,4 – 676 = 78,4 m
D = 5,6 cm × 500 = 2 800 m
G = 78,4 : 2 800
78,4 78,4
G = 1:35,73 (5)
[20]
5.4 Application of theory to a topographic map and an orthophoto
In this section we look at how the theory that you have learnt in previous chapters can be applied to a topographic map or an orthophoto.
5.4.1 Climatology
In the exam, you may be asked questions such as:
- Which slopes are the warmest?
Determine which slope faces north. North-facing slopes are the warmest. - Which slopes are the coldest?
Determine which slope faces south. South-facing slopes are the coldest. - Why are there more houses and plantations on a slope in a valley?
Determine which slope faces north. North-facing slopes are the warmest and people choose to live there. Plants also grow better there. - Where will the thermal belt occur?
Determine where the valley is and where halfway up the valley would be.
This is where you will find the thermal belt (temperature inversion). - Where will frost occur?
Determine where the bottom of the valley is. Frost pockets occur at the bottom of a valley. - Does the area experience high rainfall?
Determine the amount of cultivated land, the number of perennial rivers (flow all year round) and the total number of rivers in an area (drainage density). High-rainfall areas have lots of cultivated land, many perennial rivers indicate high drainage density. - Does the area experience low rainfall?
Determine the amount of cultivated land, the number of perennial rivers (flow all year round) and non-perennial rivers (only flow in the rainy season), and the total number of rivers in an area (drainage density). Low-rainfall areas have very little cultivated land; few, if any, perennial rivers and many nonperennial rivers; and few rivers, indicating low drainage density. - Does the area experience seasonal rainfall?
Determine the number of non-perennial streams, dams, furrows and whether the cultivated land is next to a river. Seasonal rainfall areas have mostly non-perennial rivers, many dams, furrows and the cultivated land is next to the perennial rivers.
Questions 6, 7 and 8 also test some geomorphology knowledge.
5.4.2 Geomorphology
In the exam, you may be asked questions such as:
- In which direction does the river flow?
Determine the height of the river at each point where it starts and ends on the map. A river flows downhill, so it flows from the highest point to the lowest point.
Look at the tributaries that join the main river. The direction in which tributaries join the main river follows the same direction in which the river is flowing. - Identify the drainage pattern of the river.
Determine the pattern of the river system. Is it a dendritic, radial or trellis pattern? Refer to Figure 2.2.3 C to E on page 31 showing drainage patterns in Chapter 2: Geomorphology. - Determine the underlying rock structure of an area.
Determine the drainage pattern in the area. The causes of a drainage pattern tell you the kind of rock in the area. For example, if there is a dendritic drainage then the underlying rocks are either horizontal sedimentary rock, igneous or metamorphic rock. Refer to Figure 2.2.3 C to E showing drainage patterns in Chapter 2: Geomorphology. - In which stage (course) is the river?
Determine the steepness of the sides of the valley and the steepness of the river course. A very steep valley is V-shaped and has a steep gradient.
This is where the upper course of a river is found. In contrast, if you find a wide floodplain (flat area alongside a river), meanders, marshes or vleis, and oxbow lakes, this is where the lower course of a river is found.
5.5 Geographical information systems – GIS
GIS is an organised collection of computers, computer programmes, geographic data and people. This definition gives you the components that make up GIS: People who know how to use computers (hardware) and programmes (software) to provide information (from geographic data) are able to solve a problem or answer a specific question.
Key concepts
| Concept | Definition |
| Components of GIS | Hardware (computers), software (computer programmes), data (information), people, procedures (how to solve a problem or answer a question), network (where to get the information from). |
| Spatial data | Spatial data refers to the position of an object, in other words, its co-ordinates.
For example, the spatial data for a tree could be: 29°30,3′ S; 19°10,8′ E |
| Attribute data | Attribute data is information that describes or gives the characteristics of an object.
For example, the attribute data for a tree could be: It is an acacia tree, which is 5 m tall. |
| Vector data | Spatial data stored in the form of co-ordinates, shown as point, line or polygon features. |
| a) Point features | Point features on a map include spot height, buildings and trig stations.
 |
| b) Line features | Line features on a map include rivers, roads and walls.
 |
| c) Polygon features | Polygon features on a map include cultivated land, built-up areas and dams.
 |
In a mapwork exam, you may be asked to identify a point, line or polygon feature on a map. Look at the conventional signs shown in the block (referred to in the question).
- Point features are indicated by a circle (e.g. spot height), triangle (e.g. trig. station), square (e.g. building, post office), rectangle (e.g. factory) or a single object (wind pump, dipping tank).
- Line features are indicated by a straight line (e.g. farm boundary, wall) or a curved line (e.g. rivers, roads and railways).
- A polygon feature is any sign that takes up more space than a single feature, for example, a dam, cultivated land, built-up area or golf course.
If you know and understand this definition of geographic information systems (GIS), then you will be able to answer the relevant questions in the mapwork section of the final exam. Use mobile notes to help you learn these key concepts.
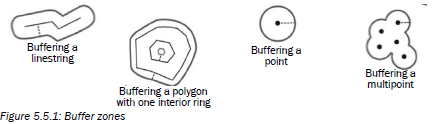
| Buffering | To demarcate (mark off) an area around an object. The marked-off area is the buffer zone.
Buffer zones often protect people from living in a dangerous area.
For example, along a river people should live above the 50-year flood line. The 50-year flood line is the height below which the river floods. The area below the 50-year flood line is the buffer zone for this area. If you live in the buffer zone your home is likely to be affected when the river floods. If you take notice of the buffer zone and live above the 50-year flood line, your home is likely to be safe when the river floods.
Figure 5.5.1 below shows how point, line and polygon features have buffer zones placed around them.
 |
| Raster data | Spatial data stored in the form of pixels. Pixels are similar to the blocks found on a topographic map (e.g. block A3). The size of the pixel (block) will determine in how much detail an area will be shown. Smaller pixels show more detail. Larger pixels show less detail. |
| Remote sensing | Taking a picture of something from far away, for example from a satellite. |
| Spatial resolution | How clear and easy the detail is to see. |
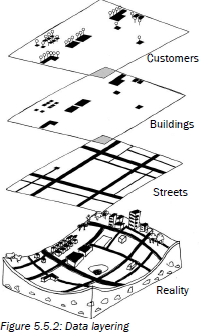
| Data or thematic layering | When different kinds of information are placed one on top of the other to see the overall picture.
For example, on the Nelspruit map, the layers of data needed to draw block D1 are:- Vegetation
- Contour lines
- Roads
- Power lines
- Built-up areas
- Water
|
| Data sharing | Data sharing is the practice of making data used for scholarly research available to other investigators. |
| Data standardisation | It is the process of achieving agreement on common data definitions, representation and structures to which all data layers must conform. |
| Data security | This means protecting a database from destructive forces and the unwanted actions of unauthorised users. This may be done by encryption, firewall or password. |
| Data querying | This is a process used to retrieve or get data from the data base. |
| Statistical analysis | The collection of methods used to process large amounts of data and report overall trends. |
Activity 5.9
Refer to the topographic map 2530BD Nelspruit and the orthophoto map extract at the back of this study guide to answer the following questions.
- Underline the correct term that matches the description below:
- Data that refers to the actual position of an object is vector/raster data. (1 × 2 = 2)
- Data that is stored in pixels is vector/raster data. (1 × 2 = 2)
- Refer to block B1 on the 2530BD Nelspruit topographic map. Give an example from this block of the following:
- Point feature (1 × 2 = 2)
- Line feature (1 × 2 = 2)
- Polygon feature (1 × 2 = 2)
- List any four layers that were used to draw this topographic map. (4 × 2 = 8)
[18]
Answers to activity 5.9- Data that refers to the actual position of an object is vector/ raster data. (2)
- Data that is stored in pixels is vector/raster data. (2)
- Point feature: spot height/farmstead/tree (any 1) (2)
- Line feature: contour/power line3/track or hiking trail/ road/dam wall/river (perennial or non- perennial)/ furrow (any 1) (2)
- Polygon feature: woodland/cultivated land/orchards/ excavations (any 1) (2)
- The following layers were used to draw the topographic map:
- Woodland – all the farming land and woodland areas
- Height – the brown contour lines
- Water – all the rivers and the perennial water and furrows
- Transport – roads and track/hiking trail (8)
[18]
|

 Key concepts

 Activity 4.3


 Calculations in mapwork need a good understanding of difference in height and straight line distance to calculate distance, gradient and area.


 (5)
(5)


 Method to determine intervisibility


 Groundwater supplies are replenished (filled up) when water infiltrates into the ground. For water to infiltrate into the soil, three important aspects should be present:


 If you know and understand the key concepts on the next page, you will be able to answer most of the questions in the Settlement section of the final exam. Make mobile notes (instructions are on page x in the introduction) and use them to learn these key concepts.


 When we study an urban profile we take note of the height, the density of the buildings, and land value.


 2.4
2.4


